Statistics for cancers in children, adolescents, and young adults
NCCR*Explorer Help
The NCCR*Explorer allows for direct comparison of one characteristic at a time (such as Race/Ethnicity, Sex, Age, or Cancer Type) for selected groups. For example, you can compare Trends over Time in Incidence of Leukemias by Race/Ethnicity for Females Ages <20.
The following steps provide an overview on how to use the NCCR*Explorer application.
Select a cancer site using the Get Started with a Cancer Site dropdown list.
Select from the list or in the first field of the list begin typing a cancer site name to see the available sites that match your term.
If you would like to compare multiple cancer sites on the same graph, select the Compare Cancer Sites option.
Select a data type using the Choose a Statistic to Explore dropdown list.
The data types in the dropdown list depend on the availability of the data for the cancer site selected.
The data type you select also determines the type of graphs available. For example Incidence allows you to select Trends Over Time, Recent Rates, and Rates by Age; while Survival allows you to select 5-Year Survival.
Select a graph type from those available by clicking on the tab.
Some graphs are line graphs while others are bar graphs depending on which is more appropriate to your selection.
You can move from the Graph tab to the Data Table tab to see specific numbers.
The graph and data table will automatically update as you make selections.
Select a Compare By variable tab.
The variable tab opens with the primary variable (the Compare By variable) at the top.
You can select Sex, Race/Ethnicity or Age to compare by.
Multiple variable values can be selected for the primary variable. For example, when comparing by sex you can select one or more of the choices which are Both Sexes (combined), Female, and Male.
Sex, Race/Ethnicity, Age
The variables not selected as the variable to Compare By are secondary variables.
Select values for the secondary variables by clicking on the plus sign to open the dropdown lists and selecting a radio button next to value you want to use.
The secondary variables can only have one value at a time.
Interface Details
An overview of the NCCR*Explorer interface.
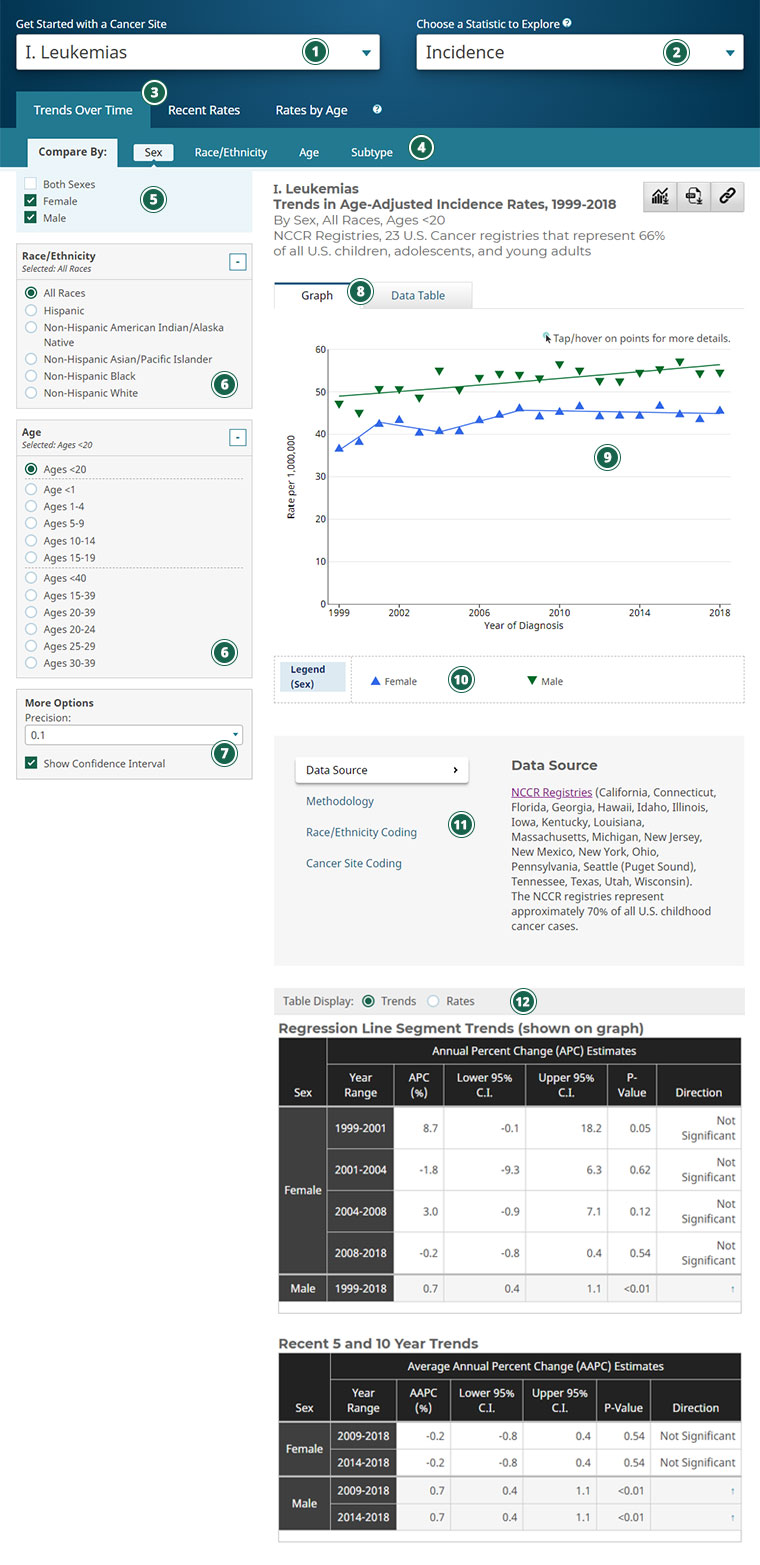
User Controls
Get Started with a Cancer Site
Choose a Statistic to Explore
This includes Incidence and Survival. See definitions by clicking on the question mark.
Graph Type
See definitions by clicking on the question mark.
Compare By tabs
Compare By variable values
Select more than one value to have a comparison.
Secondary variables
Select only one value from each variable.
More Options – See More Options section for details.
Results
Selection Tabs
Graph
Legend
Foot Notes
Data Table
The data table may have choices. If so you can change your selection using the radio buttons.
More Options
The controls available under More Options are dependent on the statistic. All of the possible controls that can appear in More Options:
Precision – The number of decimal places shown in the table for Annual Percent Change (APC) or Rates may be specified here. You can set the value to 0.1, 0.01, 0.001, or 0.0001.
Show Standard Error – When this option is checked, Standard Errors will be displayed in the data table and will also be displayed if you hover over a data point on the graph.
Show Confidence Interval – When this option is checked, the confidence intervals (CI) will be displayed in the data tables as columns for C.I. Low and C.I. High. The values will also be displayed if you hover over a data point on the graph.
Available Statistics
Incidence
Incidence is the number of new cases of the specific cancer site/type per 1,000,000 people in the U.S. Number of new cases per number of people in a population are also referred to as incidence rates.
Trends Over Time
Recent trends present the observed (points) and modeled (lines) annual age-adjusted rates and corresponding annual percent change (APC) trend for each joinpoint segment in the table. Modeled are estimated using the joinpoint software. Recent trends are available from 2001 through the current year of available data.
Recent Rates
Recent rates present the age-adjusted rate for the aggregated five most recent years of the available data, in a bar chart format.
Rates by Age
Rates by age refer to a rate for a single age for the most recent 5-year time period. NCCR provides data for individual ages up to age 39. Rates by age are also referred to as age-specific rates.
Survival
Relative survival is an estimate of the percentage of patients who would be expected to survive the effects of their cancer. It excludes the risk of dying from other causes. Relative Survival statistics compare the survival of patients diagnosed with cancer with the survival of people in the general population who are the same age, race, and sex and who have not been diagnosed with cancer.
5-year Survival
5-year relative survival rates show the estimated percentage of patients who would be expected to survive the effects of their cancer five years or more after cancer diagnosis. It excludes the risk of dying from other. Patients diagnosed over a seven year period are included to allow enough follow-up time for an accurate measure of 5-year survival.
Prevalence
Cancer Prevalence is the number or percent of people alive on a certain date who have been diagnosed with cancer. In Prevalence we show complete prevalence (people alive ever diagnosed with cancer) .
Complete
Complete prevalence represents the proportion of people alive on a certain day who previously had a diagnosis of the disease, regardless of how long ago the diagnosis was, or whether the patient is still under treatment or is considered cured. Complete prevalence is presented as U.S. counts or percent for all races combined by age and sex.
Definitions
Age-Adjusted Rate
A method allowing comparisons of populations that takes into account age-distribution differences between populations.
Confidence Interval
A range of values that have a specified probability of containing the rate or trend.
P-Value
Used in the calculation of confidence intervals and in significance testing. The default value for all p-values is 0.05 (equivalent to a 95% confidence interval or 0.05 significance).
Standard Error
The standard error of an estimate is a measure of the sampling variability of the estimate.
Frequently Asked Questions
How do I do cross-comparisons of multiple characteristics, for example Race and Sex?
In NCCR*Explorer, you can only compare one characteristic at a time (chosen on the Compare By box). To do cross comparisons for example, incidence rates for leukemias by Race and Sex, you can download the data in CSV format to be used with external graphic software like Microsoft Excel.
How do I compare multiple types of cancer?
In the cancer site selection dropdown list, please select the option to Compare Cancer Sites. This selection will enable a button in the Compare By Area that allows you to select multiple cancer sites for comparison.